
I believe it was the Notorious B.I.G. who once famously stated, “Mo’ posting, mo’ social engagement.”
On the surface, that idea seems to make sense. After all, the more posts you send out into your social network, the more opportunities you’re creating for folks to Like, share, retweet, or comment on your posts, right?
If the Notorious B.I.G. was correct in his assessment, then increasing the number of social media posts you publish per week should have a positive effect on overall engagement levels.

Unfortunately, that doesn’t seem to be the case.
Data from our new 2015 Social Media Benchmarks Report shows no discernible correlation between the average number of posts companies publish per week across all of their social networks and the average number of interactions (e.g., Likes, retweets, etc.) each of those posts receives.
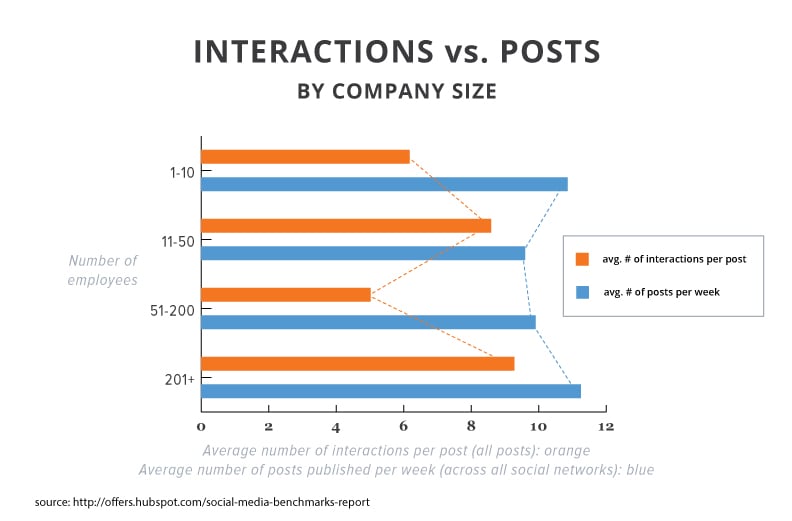


In the above graph, you’ll see there is no clear correlation between posts published per week (blue) and interactions per post (orange). If there were a correlation, those dotted blue and orange lines would follow a similar pattern.
Instead, as the average number of posts published per week decreases from the 1-10 company size group to the 11-50 group, the average number of interactions per post increases. And when posts per week increase slightly from the 11-50 group to the 51-200 group, interactions per post decrease significantly.
The only hint of alignment comes with the final two company size groups: Posts and interactions both increase when we move from the 51-200 group to the 201+ group.
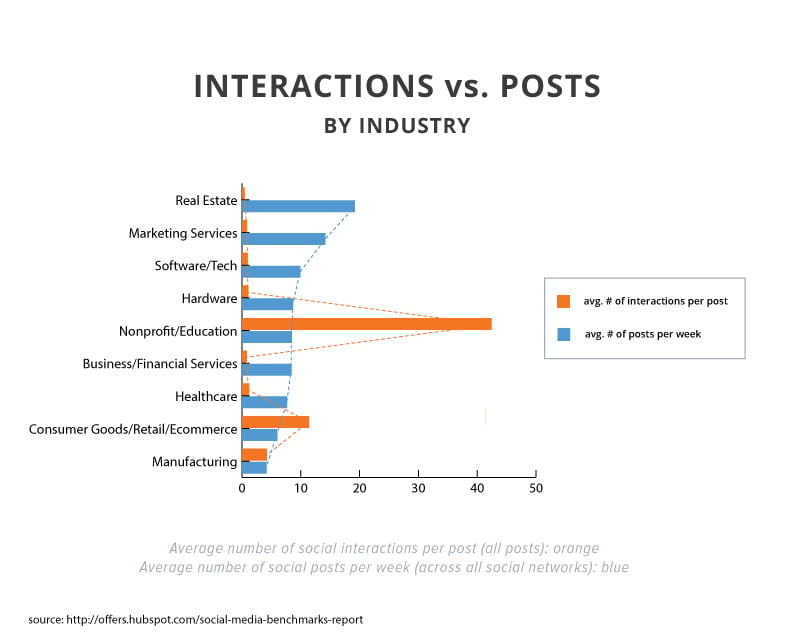
When we look at the same data set organized by industry, we get the same story — there isn’t a positive correlation between posts per week and interactions per post. If anything, there’s a very slight negative correlation between the two: The two industries that post the least (consumer goods/retail/ecommerce and manufacturing) have two of the highest interaction per post averages.
But then again, the industry with the highest interaction per post average — nonprofit/education — has a post frequency that’s right in the middle of the pack. So, what’s going on here?
Clearly, social media posting frequency on its own isn’t a strong predictor of social engagement. But I wonder … could there be other factors that, when combined with social posting frequency, could do a better job of predicting engagement?
(Spoiler alert: The answer is “yes!” And you can learn more by downloading the full 2015 Social Media Benchmarks Report here.

![]()

