Views, new visitors, returning visitors — they sound similar but these metrics are not the same. If you don’t know the difference, you could be misinterpreting your website data and making some ill-informed decisions.
We’re going to cover everything you need to know about web analytics so you can truly understand what’s what, interpret your website analytics correctly, and make well-informed, data-backed decisions for your website and business.

In this post, we’ll cover the following. You can click on any of the jump links to skip to that section:
- what web analytics is and why it’s important
- web analytics examples
- web analytics best practices
- web analytics tools
- web analytics api
There is tons of data you can collect to understand how people interact with your website and identify opportunities for improvement. You can track overall traffic, bounce rate, traffic sources, new and returning visitors, time spent on site, and much more.
The amount of data can be overwhelming at first. That’s why it’s important to identify a few key metrics, particularly as you’re getting started. For example, you might start by focusing on bounce rate on a few key pages on your site. If visitors are quickly bouncing from your homepage, then that indicates they’re not finding the information they’re looking for quickly or easily enough. From there, you can identify possible next steps, like redesigning your website navigation.
Let’s take a closer look at why web analytics is important below.
Importance Of Web Analytics
Web analytics is critical to the success of your business. It enables you to better understand your site visitors and use those insights to improve the experience on your site. For example, if you discover that the majority of users on your site are using a mobile device, then you can focus on making your website more mobile-friendly.
Web analytics can also shape your content and SEO strategy. Looking at your top viewed posts, you can begin to identify what types of content and topics perform best with your audience. If you notice how-to WordPress tutorials make up the majority of your top viewed posts, for example, then you might shift and narrow your focus from definition articles about anything web-related to how-to WordPress tutorials. Or maybe you look at your site’s traffic sources and notice that organic and email traffic are your top drivers and paid channels are your lowest. In that case, you might shift resources to invest more in your organic strategy than paid.
Now that we have an idea of what web analytics is and why it’s important, let’s look at some key metrics you might track to measure progress against — and eventually meet — overarching business objectives, like increasing website traffic, leads, and revenue.
Before you read on, it’s important to note that various analytics tools may have slightly different definitions of the following terms. It’s best to consult your particular tool’s documentation to understand exactly how each is calculated.
Pageviews
Pageviews is the total number of times a page was viewed on your site. A pageview (or view) is counted when a page on your site is loaded by a browser. So if a person were to view a page on your site and reload the page in their browser, that would count as two views. If a person viewed one page, viewed a second page on your website, and then returned to the original page, that would count as three views.
Pageviews can give you an idea how popular a page on your site is — but it’s important to look at in context of other metrics. A page with a high number of views for a post isn’t necessarily popular since a small group of visitors could be responsible for a lot of those views. A high number may also indicate that a page was confusing and required visitors to return to it multiple times.
Unique Pageviews
Unique pageviews is the total number of times a page was viewed by users in a single session. In other words, a unique pageview aggregates pageviews that are generated by the same user during a session (which we’ll define below). So if a person viewed the same page twice (or more times) during an individual session, unique pageviews would only count that pageview once.
Since this metric discounts instances in which a user reloads or visits the same page in the same session, unique pageviews help you get a better understanding of how many visitors are viewing pages on your site and how popular individual pages are.
Sessions
A session is a group of interactions — including not only page views, but activities such as CTA clicks and events — that take place on your website within a given time frame.
The timeframe of a session varies by web analytics tool. For example, sessions in Google Analytics and HubSpot’s traffic analytics tools last 30 minutes by default. A session ends and a new session starts for a user when either A) there has been 30 minutes of inactivity and the user becomes active again, B) the clock strikes midnight, or C) a user arrives via one traffic source, leaves, and then comes back via a different source.
That means, if a user lands on your site, leaves, and returns within 30 minutes, Google Analytics and HubSpot will count it as one session, not two. On the other hand, if a user is inactive on your site for 30 minutes or more but then clicks on a CTA or takes another action, Google Analytics and HubSpot will count it as two sessions, not one, even if the user never left your site.
New Visitors
New visitors — also termed new users, unique visitors, or new visitor sessions, depending on the web analytics tools — is the number of unique visitors on your website.
As the name implies, a new visitor is an individual who visits your site for the first time. These individuals are identified by a unique identifier. For example, when using HubSpot, the HubSpot tracking code is installed on your site. Then, visitors on your site are tracked by the cookie placed in their browser by this tracking code.
Two important notes to keep in mind. A single visitor can have multiple sessions and pageviews on your site. And unique visitors is not an entirely accurate metric. That’s because most web analytics tools use cookies to track visitors, which doesn’t always distinguish new visitors from returning ones (which we’ll define below). For example, if a person visits your site via their mobile phone and then on their personal computer, they’ll be counted as new visitors on both occasions.
Returning Visitors
Returning visitors (or users) is the number of visitors on your website who have visited before. Not all web analytics tools include this metric, but some — including Google Analytics — do. In Google Analytics’s Audience reports, you can look at behaviors to see the ratio of new to returning users on your site.
Looking at both new and returning visitors metrics are great for getting a sense of how well you’re retaining your visitors, and how effective you are in attracting net new visitors at the top of the funnel.
Again, just keep in mind that this metric won’t be completely accurate if the web analytics tool uses cookies to track visitors.
Traffic Sources
Traffic sources is a metric that shows where your site visitors are coming from. Like visitor information, this metric is usually collected via the tracking code on your site.
The number of traffic sources you can track will vary depending on the web analytics tool. HubSpot’s traffic analytics tools tracks multiple categories, including:
- Organic Search
- Referrals
- Organic Social
- Email Marketing
- Paid Search
- Paid Social
- Direct traffic
Ideally, you want to increase all sources of traffic. But your biggest focus should be organic search, which is traffic that comes from non-paid search results in search engines like Google. That’s because this source has potential to drive huge amounts of traffic to your site. Plus, improving this channel often improves other channels, like referrals and social, as well.
Bounce Rate
Bounce rate is the percentage of visitors that leave your website after viewing a single page. You can look at bounce rate as a site-wide metric, or a page-level one. If your site’s bounce rate is high, then it might help to identify pages with high average bounce rates.
At the page level, average bounce rate is the percentage of sessions that started on the page and did not move to another page on your site. A high average bounce rate might indicate there’s a problem with the page’s loading time, or that external links are not opening in a new tab or window, among other reasons.
To learn what actions you can take to reduce bounce rate in WordPress or another platform, check out How to Reduce Bounce Rate in WordPress.
Web Analytics Best Practices
Many aspects of web analytics are specific to your business: what metrics you track, how you build out reports, what tools you use. But there are some best practices that can help anyone collect, analyze, and report website data in a more consistent and effective way. Let’s look at a few.
1. Pick metrics that align with your business objectives.
Focusing on only one or two metrics won’t provide enough insight into how visitors are interacting with your site — but tracking every single metric might provide too much information. To make sure you’re focusing on the right metrics, start by plotting your business objectives. Think: what are the top priorities for your site? Then, think of specific strategies you’ll implement to achieve these objectives, like fixing broken links and images. You’re now ready to identify what metrics will help you track your progress for achieving your goals and ultimately your business objectives.
2. Use data to drive decision making.
After collecting and reporting your data, figuring out whether or not you met your goals is only the first step. The next — and arguably more important — step is to use that data to test, experiment, and make changes on your site. For example, say you identified some high-value content — like your Services and Pricing page — through user testing and feedback in your web design process, but these pages aren’t getting much traffic. In that case, you might move these navigation links from your footer to your header or implement other changes to make these pages easier to find.
3. Don’t limit your focus to traffic.
Understanding and reporting traffic data — including pageviews, top traffic sources, and most viewed pages — is important. But it’s just one piece of your website performance. High traffic doesn’t necessarily mean success. If you’re getting millions of pageviews but no conversions, then you’re probably not meeting all your business objectives.
4. Always pair data with insights.
If you report that your website got one million unique pageviews and four hundred thousand new visitors in a month, that doesn’t mean all that much. Only reporting the numbers provides an incomplete picture of your website performance. It’s essential that you pair this data with insights. If you report that your website got one million unique pageviews, which exceeded last month’s unique pageviews and showed a percent increase year over year, then the data is much more meaningful.
5. Look at your data in context.
While collecting and analyzing data, think about it in context. What variables or larger forces could be impacting the numbers? For example, seasonality, algorithm updates, and bots can all have a major impact on your traffic and other metrics. Say, a few pages on your site saw major spikes in traffic. These posts weren’t recently updated so you look where this traffic came from. If the traffic mostly came from one country where you usually don’t see much traffic, like Ukraine, Thailand, Vietnam, Turkey, or Russia, then this was likely bot traffic. Looking at your data in context can help you better understand, analyze, provide insights, and make informed decisions with your data.
6. Share and ask for feedback from stakeholders.
You want to provide information to stakeholders in a consistent and understandable way. You also want to ask for information and ideas from these stakeholders. They can provide valuable feedback on how they use the data, what else they want to see or understand about their users or website, and how they think they can improve the user experience or other issues the data uncovers.
Web Analytics Tools
Measuring organizational success requires more than one metric — and more than one tool. Let’s take a look at three web analytics tools you could use together.
HubSpot Marketing Analytics & Dashboard Software
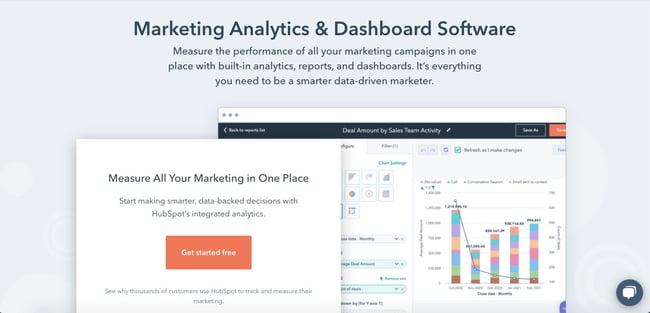
With HubSpot’s free marketing analytics and dashboard software, you can measure the performance of all your marketing assets — from website and landing pages, to emails, blog posts, social media accounts, calls-to-action, and more — in one place. You’re able to track the complete customer lifecycle, measure traffic overall or on a page-by-page basis, and add multiple reports to your dashboard so you’re tracking your most critical metrics in one easy-to-access place.
HubSpot’s free tool is ideal for anyone looking for built-in analytics, reports, and dashboards so they can make smarter, data-driven decisions.
Google Analytics
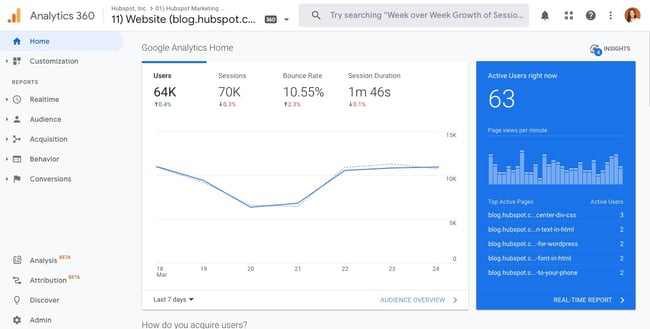
Used by over 28 million websites, Google Analytics is one of the most popular web analytics tools. With this tool, you can track pageviews, unique pageviews, bounce rate, traffic channels, user retention, average session duration, sessions by country, sessions by device, and more. You can also build out reports about your audience, acquisition channels, website performance, and conversions in Google Analytics.
Understanding the value, flexibility, and popularity of Google Analytics, some platforms offer unique integrations with this tool. Analytics Amplifier, for example, is a HubSpot app that allows users to match HubSpot customer behaviours — including “hot leads” and “deal amount” — with real-time Google Analytics data.
The sheer amount of metrics, reports, and integrations that can be tracked or created using Google Analytics can be overwhelming. Users without SEO or technical expertise, like content creators, may find it difficult and prefer an alternative.
Crazy Egg

Used by over 300,000 users, Crazy Egg is a unique web analytics tool that provides heatmaps, scrollmaps, and other visual reports to show you exactly how your visitors are interacting with your site. Thanks to Crazy Egg’s tracking code, you’ll be able to watch what visitors are hovering over and clicking on in real time via heatmaps.
Crazy Egg also also offers comprehensive A/B testing so you can test various content variables like color, copy, and content placement, to see how it affects the user experience and conversions. This makes Crazy Egg an ideal alternative or supplement to Google Analytics for users interested in conversion optimization.
For example, Google Analytics offers several APIs that you can use to automate complex reporting and configuration tasks. One such API is the Google Analytics Reporting API. With this API, you can build custom dashboards to display your Google Analytics data, automate complex reporting tasks to save time (like getting data in two date ranges with a single request), and integrate your GA data with other business applications.
Another popular example is Chartbeat’s Real-Time API. This API consists of data that is updated every three seconds so you can see how your visitors are interacting with your content in real time. You can use this data to improve audience engagement, inform editorial decisions, and increase readership, which is why Chartbeat is used by bigwig news organizations including The New York Times and The Washington Post.
To understand what APIs are and how they work in general, check out The Ultimate Guide to Accessing & Using APIs.
Using Web Analytics to Improve Your Website
Whether you’re a small business, ecommerce site, or enterprise company, web analytics can help you and your company grow. By collecting, reporting, and analyzing data about your website, you can improve the user experience on your site and meet larger business objectives like increasing online sales.
Editor’s note: This post was originally published in July 2014 and has been updated for comprehensiveness.

![]()

