Infographics that really stand out are far more than just a smattering of pictures and charts. They might tell an engaging story — one built around compelling data, graphics, or illustrations. Or perhaps they serve as a really helpful visual resource.
While great infographics come in a variety of forms, the common thread is that they’re visually pleasing and designed in a way that makes complex topics easy to understand whether you’re a novice in the subject or an expert.
Here are 11 brands from all different industries — from education to insurance — that totally nailed their infographics this year. Check ’em out and get inspired.
Download our 10 free infographic templates in PowerPoint here so you can create great infographics of your own.
11 Great Infographic Examples of 2015
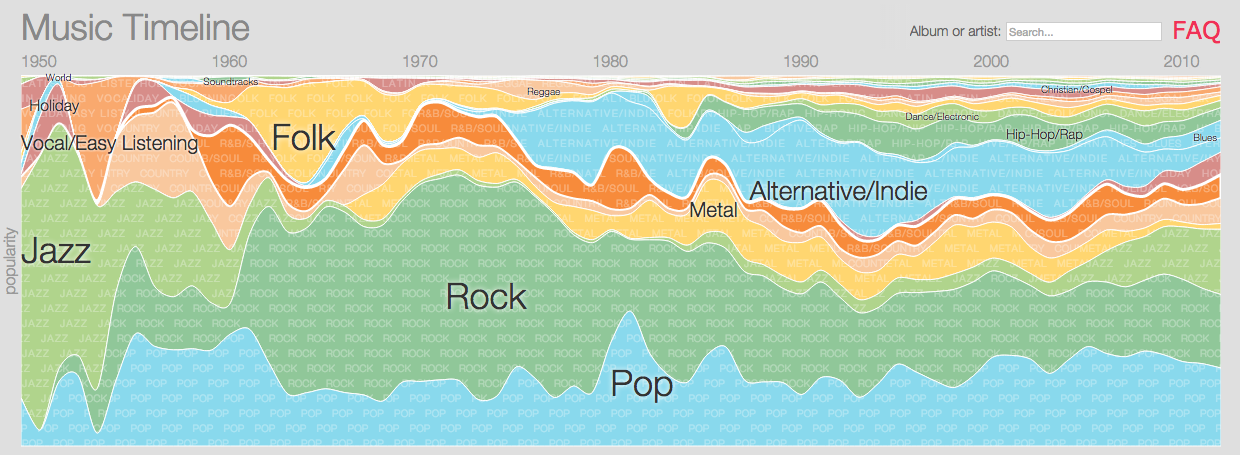
1) Music Timeline, by Google
The best infographics communicate information in an intuitive and beautiful way. Google nailed it with their “Music Timeline” microsite, which visualizes music trends from 1950 to present, by popularity. The best part? The version on their site is interactive: When you click on one of the genres, you’ll get a more detailed visualization of that genre’s popularity along with a list of the most popular albums of the time in that genre.

2) The Daily Routines of Famous Creative People, by Podio
In this infographic, the folks at Podio took a simple concept and executed it fantastically. Using information from the book Daily Rituals by Mason Currey, it shows the daily schedules of famous creatives broken down by time and activity. Not only is this an example of engaging data, it’s also a fantastic editorial piece for a brand.

3) Men’s Dress Codes Made Simple, by Samuel Windsor
The visual elements of an infographic are the most important part — that’s why you made the content into an infographic in the first place, after all. When you have a topic that’s inherently visual, an infographic is a great way to go. The graphic below decoding men’s formalwear reads like a cheat sheet. The design is simple and intuitive — and the paisley design behind the title is a fun nod to the menswear industry. We also love how there’s no more copy on here than there needs to be — just a few simple titles and a handful of bullet points.

4) 10 Dinner Table Customs From Around the World, by Wimdu
Any time you’re writing about the “do” vs. “don’t do” dichotomy, you might consider making an infographic out of it. You can easily put each “do” and “don’t” beside one another in two columns for a great visual — just look at the example below of dinner table customers from around the world. Each section is a different country, inside of which is one important dinner table custom that readers may not know about if they’ve never been to that country. Capping the number of tips per country to one keeps the content from feeling overwhelming.

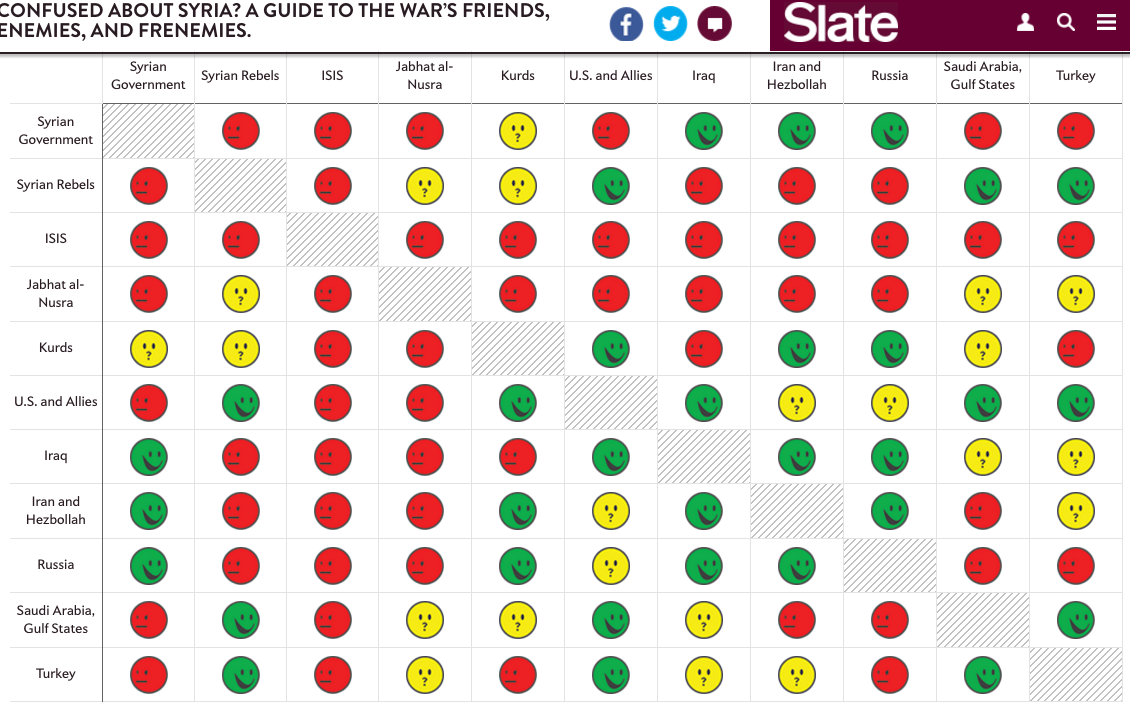
5) A Guide to Who’s Fighting Whom in Syria, by Slate
Mapping out the relationships between two or even three entities can be pretty simple. But what about when you have a lot of things to compare to one another? That’s where putting that information into infographic form can really help you educate your readers in a way they’ll understand. In Slate‘s case, they wanted to show the relationships among groups of people in the Middle East who are involved in the Syrian Civil War. By using a table format and familiar visuals and colors, the folks at Slate did a great job simplifying this data into a digestible format — and the version on their website is beautifully interactive.

6) How Music Affects Your Driving, by No Nonsense Insurance
Work in a “boring” industry? Believe it or not, you can still create interesting and exciting content — even if you’re not working with a “sexy” topic such as food, travel, or culture. Want proof? An insurance company created the infographic below on how music affects your driving. Not only are the graphics fun, but there’s a lot of helpful content in there, including facts and statistics paired with great visuals. Read this blog post for more tips on creating interesting content in a “boring” industry.

7) Our Dwindling Food Variety, by National Geographic
Infographics don’t have to be long to be great — it’s all about how well the data is conveyed visually. The infographic below from National Geographic is short but sweet: It shows how many varieties of different kinds of fruit and vegetable seeds we had a century ago in comparison to today. Instead of using a traditional bar chart, they chose to hit the point home by designing a chart that looks like a plant.

8) #GivingTuesday By the Numbers, by Classy
The look and feel of each infographic has a lot to do with brand personality. Here’s a great example of an infographic with a design that stays true to brand. It pairs fun fonts with cute, block-color graphics. For example, check out the first set of bar charts: They use tree graphics in place of classic bars to make it more visually interesting without sacrificing clarity.

9) Cost of Living Around the World, by MoveHub
Here’s another example of an infographic on an interesting topic that isn’t riddled with numbers — but this one’s even simpler. There are no bells and whistles here: no introduction, simple colors, and not a lot of copy. The only thing missing is a short explanation of where the data comes from. Although they include a link to the source at the end and also offer more details about the data in their own blog post’s introduction, it would have been helpful for others hoping to share the image or embed it on their site to have that information somewhere on the graphic. Still, we love the simplicity and straightforwardness of both the topic and design.

10) The Anatomy of a Perfect Checkout Page, by VWO
Here at HubSpot, we find that infographics on the “anatomy” of something typically do quite well. Here’s a great example of one from VWO. It takes the reader through an example of what the “perfect” version of a checkout page would look like. The graphic breaks the page down into manageable chunks that are easy to follow. At the same time, the design is fun and attractive, combining colorful graphics with screenshots of real checkout pages for reference.

11) How to Keep Fruits & Vegetables Fresh Longer, by Full Plate Living
Who knew that some fruits and vegetables “get along” better with others in storage? I certainly didn’t, and I found this infographic to be a wonderfully simple, yet comprehensive visual guide. The timelines are clear and readable, and each of the visuals is easy to skim so readers don’t even have to read the names under each piece of food (unless they aren’t sure what a plum look like).

Which infographics from this list was your favorite? What other top-notch infographics have you come across from 2015?
Editor’s Note: This post was originally published in July 2015 and has been updated for accuracy and comprehensiveness.
![]()


